
The Rolling 12-Month Email Activity Report is designed to give your marketing team an overview of your email campaigns and a few key statistics. This will allow you to see trends in email data at a glance AND allow you to compare the effectiveness of your email outreach over time.
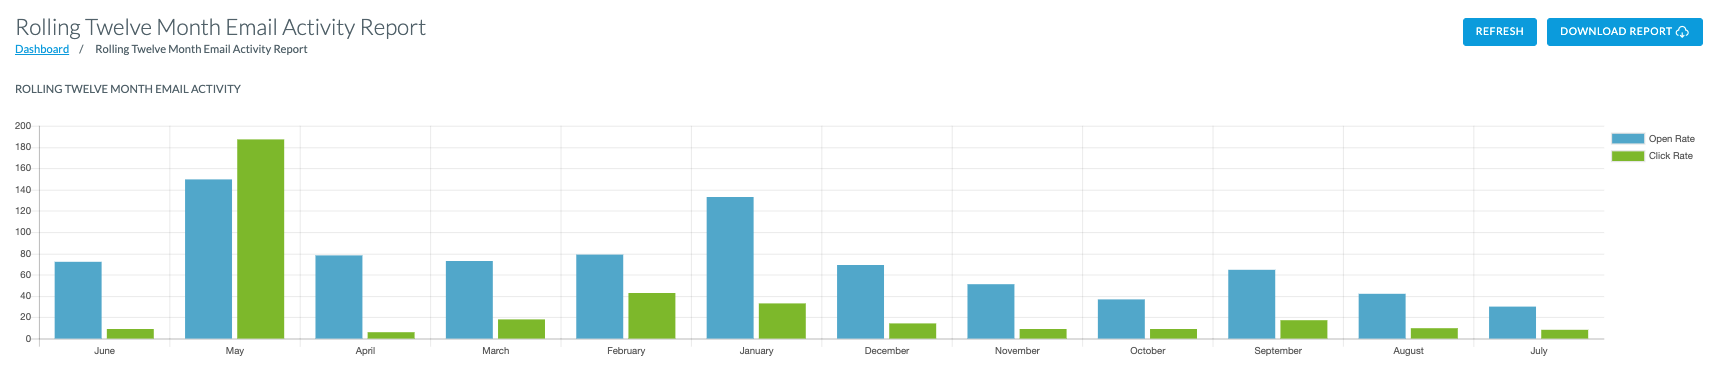
The top graph will compare the open rate vs click rate for each month.
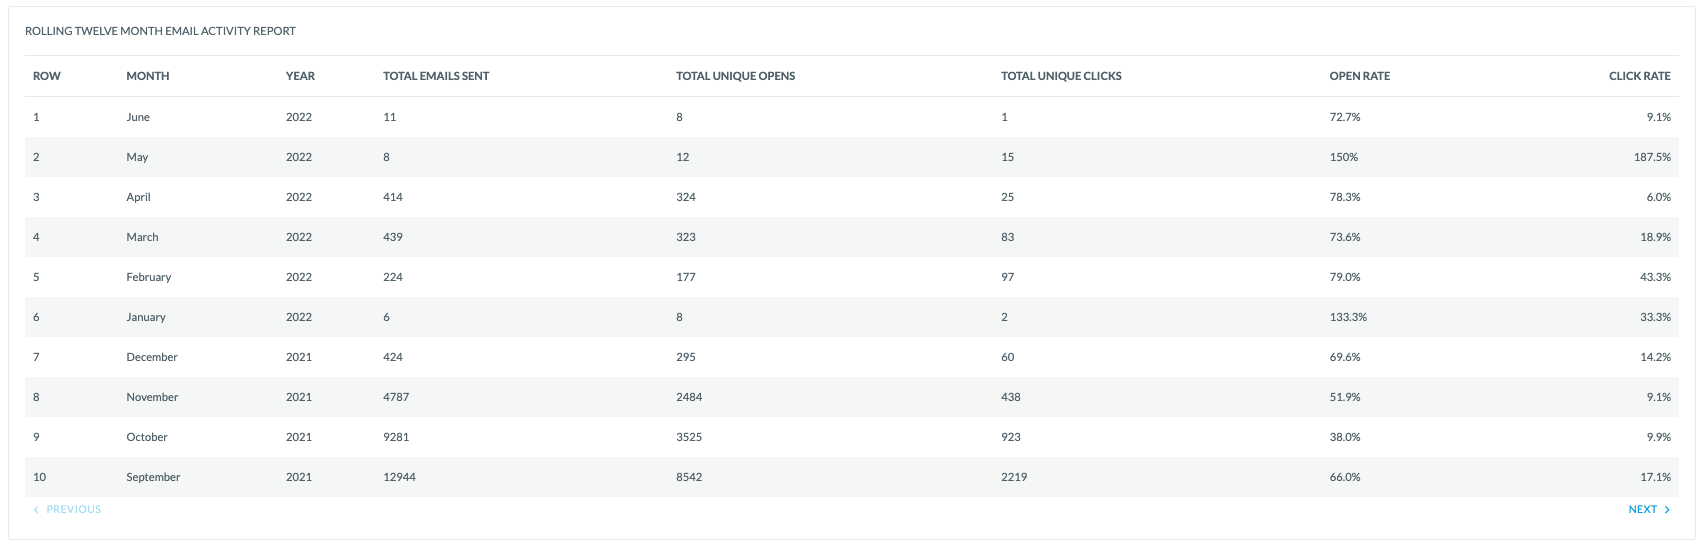
Then, the bottom chart will include the Total Emails Sent (per month), Total Unique Opens, Total Unique Clicks, Open Rate Percentage, and Click Rate Percentage.
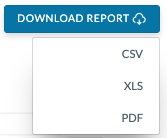
You'll have the ability to download this report to a CSV, XLS, or PDF in the top right button.
You'll also want to be aware of your email Spam Threshold to stay on top of good email practices!